Your SAP already has the answers. Your leadership can't see them.
Sria Infotech turns raw SAP data into interactive dashboards, automated reporting and live KPI monitoring — one governed, trusted source of truth from shop floor to boardroom.
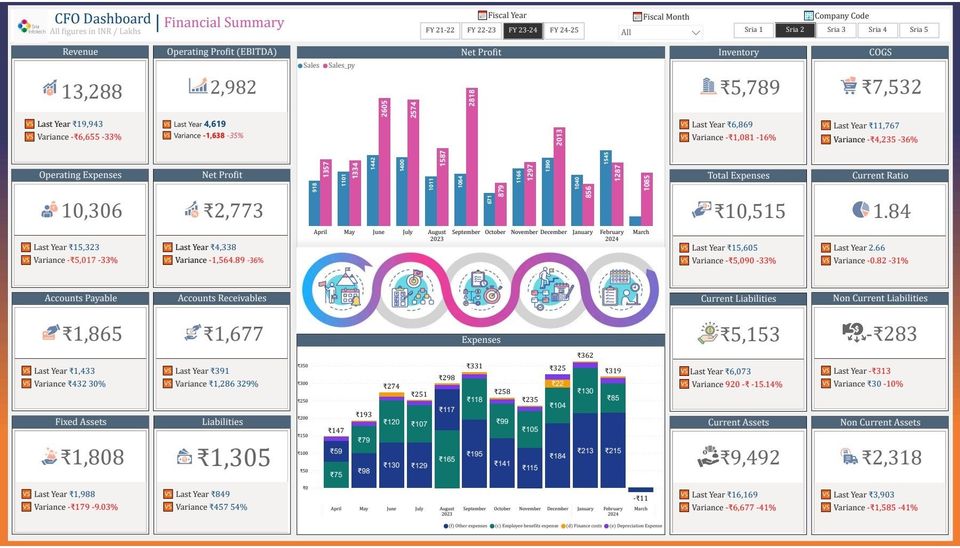
Real client deliverable
Built on live SAP data
4
Governed architectures
7
Phase delivery model
12+
Dashboards delivered
8–14
Weeks to go-live
Why real-time visibility matters
Most enterprises run their most critical processes inside SAP, yet decision-makers still wait on spreadsheets that arrive too late to change the outcome.
Fragmented reporting
Finance, sales and operations each maintain separate extracts — no one sees the same numbers at the same time.
Delayed decisions
Month-end close cycles and manual consolidation mean leadership reacts to problems weeks after they occur.
Manual effort & errors
Analysts spend hours reconciling exports instead of analysing trends, multiplying copy-paste risk.
Missed opportunities
Without live KPI monitoring, working-capital risk, stockouts and margin erosion surface too late to act on.
Four proven paths from SAP to insight
Select a path to see how the data flows. We recommend the architecture that fits your landscape — not the one tied to a vendor relationship.
Microsoft Fabric + Power BI
A unified Microsoft analytics platform — OneLake, Data Factory, Warehouse and Power BI in a single governed environment. This is Sria Infotech's recommended strategic platform for most customers.
Features
- Unified analytics platform
- Built-in AI Copilot
- Real-time analytics
- Enterprise governance
Advantages
- Native, seamless Power BI integration
- Modern, future-ready architecture
- Lower administration effort
Best for
Organizations already invested in Microsoft 365 and Azure who want one governed platform for data and BI.
Solution comparison matrix
| Dimension | SAP HANA + Power BI | GCP BigQuery | MS Fabric + Power BI | SAP Datasphere + SAC |
|---|---|---|---|---|
| Implementation speed | Fastest | Moderate | Fast | Moderate |
| Native SAP integration | Excellent | Via APIs / SLT | Good | Deepest |
| Scalability | Good | Unlimited | Very high | High |
| AI / ML capability | Limited | Excellent | Strong (Copilot) | Planning-focused |
| Infrastructure cost | Lowest | Usage-based | Moderate | Moderate–High |
| Best fit | Existing HANA shops | AI-first enterprises | Microsoft 365 / Azure orgs | SAP BTP standardised orgs |
Implementation speed
- SAP HANA + Power BI
- Fastest
- GCP BigQuery
- Moderate
- MS Fabric + Power BI
- Fast
- SAP Datasphere + SAC
- Moderate
Native SAP integration
- SAP HANA + Power BI
- Excellent
- GCP BigQuery
- Via APIs / SLT
- MS Fabric + Power BI
- Good
- SAP Datasphere + SAC
- Deepest
Scalability
- SAP HANA + Power BI
- Good
- GCP BigQuery
- Unlimited
- MS Fabric + Power BI
- Very high
- SAP Datasphere + SAC
- High
AI / ML capability
- SAP HANA + Power BI
- Limited
- GCP BigQuery
- Excellent
- MS Fabric + Power BI
- Strong (Copilot)
- SAP Datasphere + SAC
- Planning-focused
Infrastructure cost
- SAP HANA + Power BI
- Lowest
- GCP BigQuery
- Usage-based
- MS Fabric + Power BI
- Moderate
- SAP Datasphere + SAC
- Moderate–High
Best fit
- SAP HANA + Power BI
- Existing HANA shops
- GCP BigQuery
- AI-first enterprises
- MS Fabric + Power BI
- Microsoft 365 / Azure orgs
- SAP Datasphere + SAC
- SAP BTP standardised orgs
Dashboards we've built on real SAP data
Live Power BI dashboards delivered for a multi-plant manufacturing group — finance, sales, cost and working capital, all from a single governed data layer.
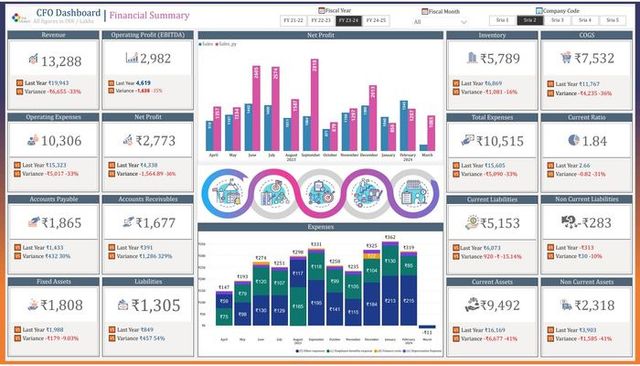
Finance
CFO Dashboard — Financial Summary
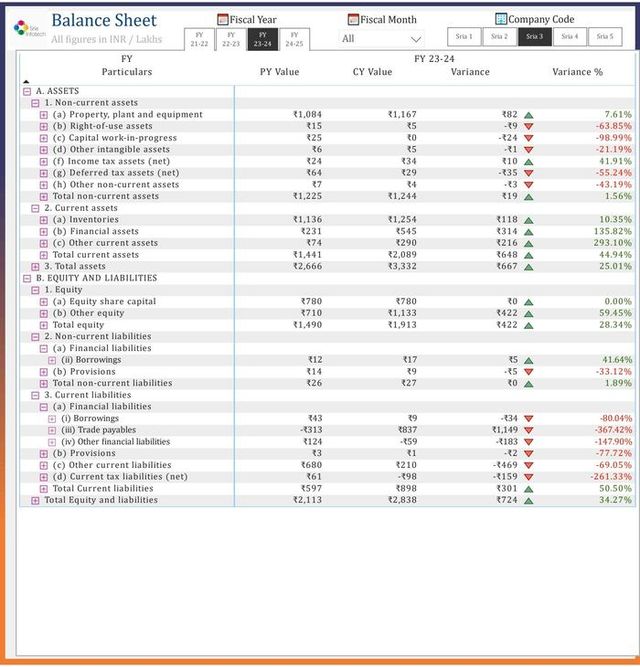
Finance
Balance Sheet — Assets, Equity & Liabilities
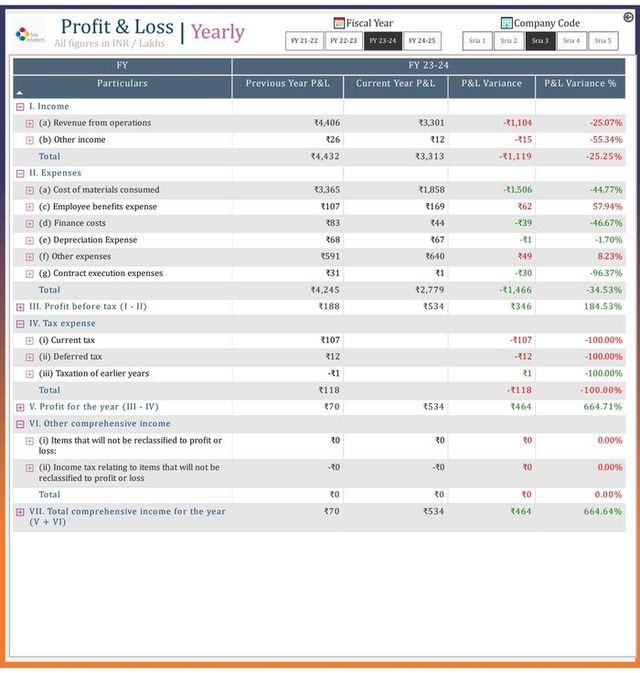
Finance
Profit & Loss — Yearly
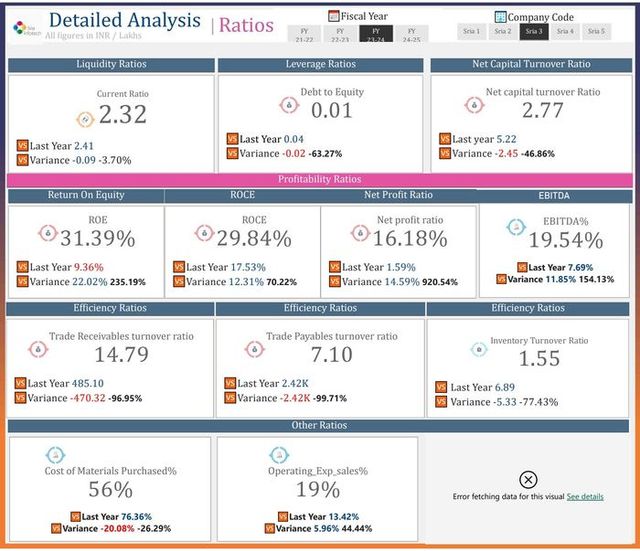
Finance
Detailed Analysis — Financial Ratios
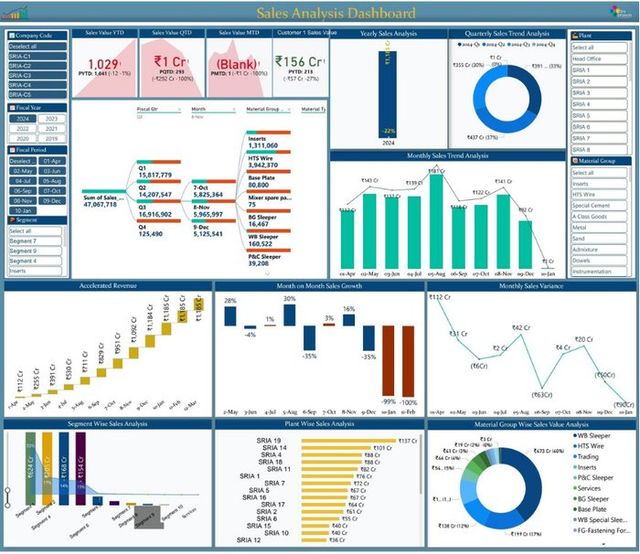
Sales
Sales Analysis Dashboard
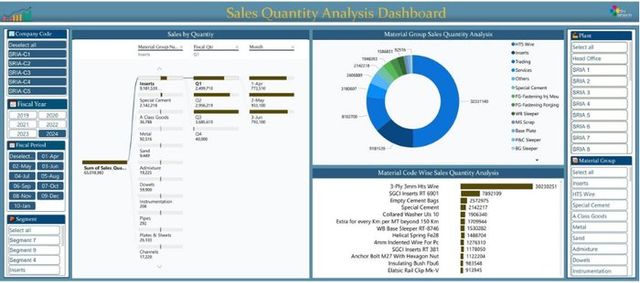
Sales
Sales Quantity Analysis
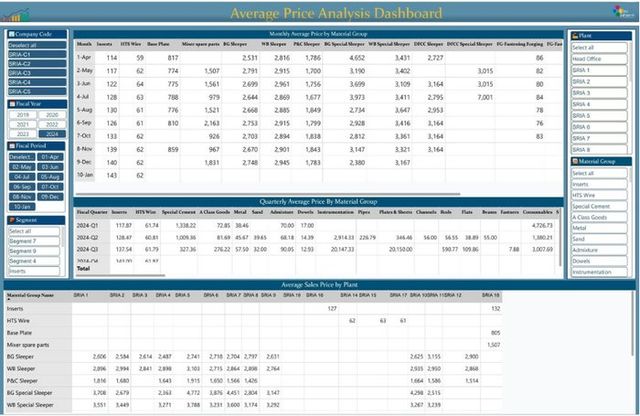
Sales
Average Price Analysis
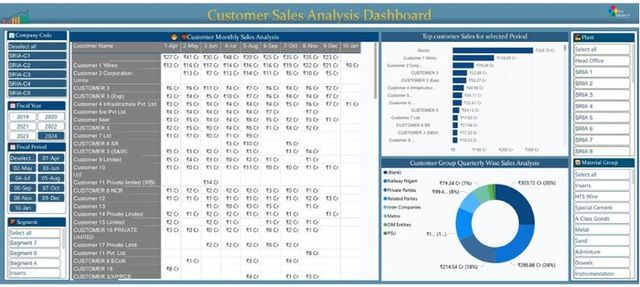
Sales
Customer Sales Analysis
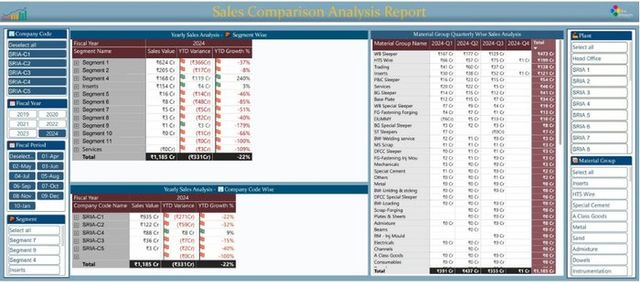
Sales
Sales Comparison Analysis
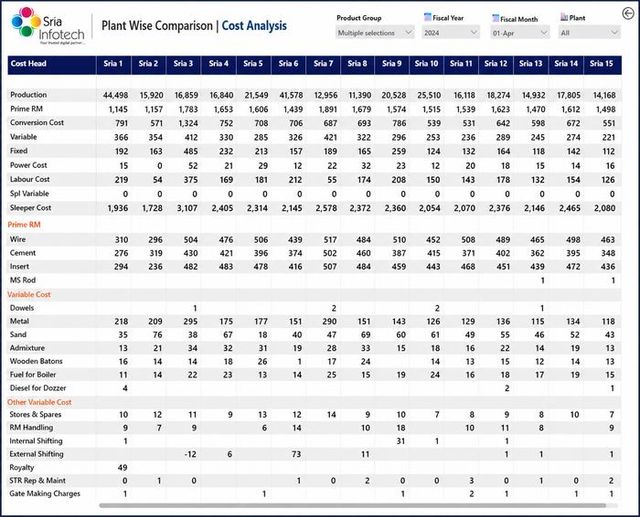
Cost
Plant Wise Comparison — Cost Analysis
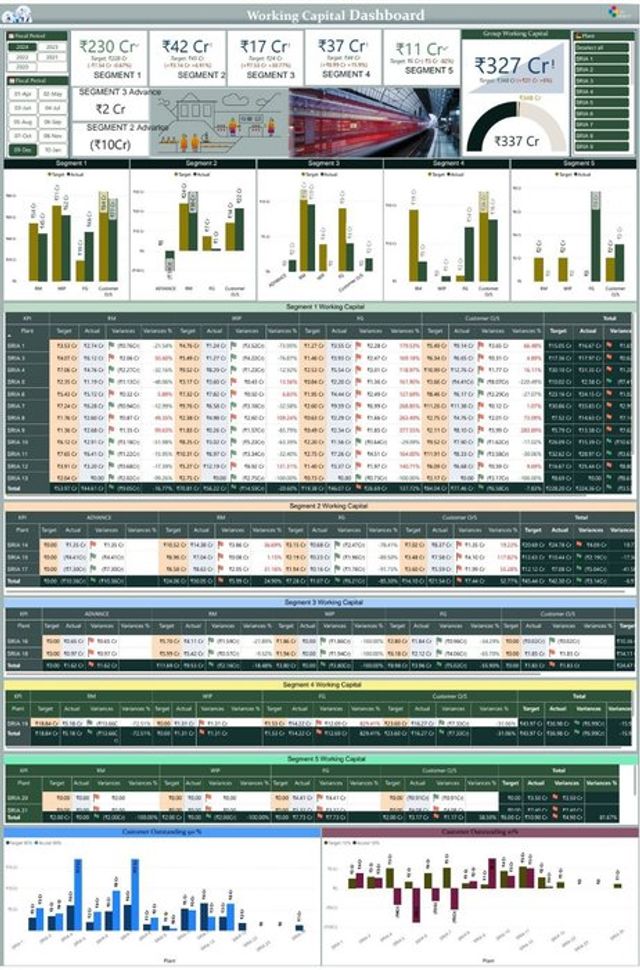
Working capital
Working Capital Dashboard
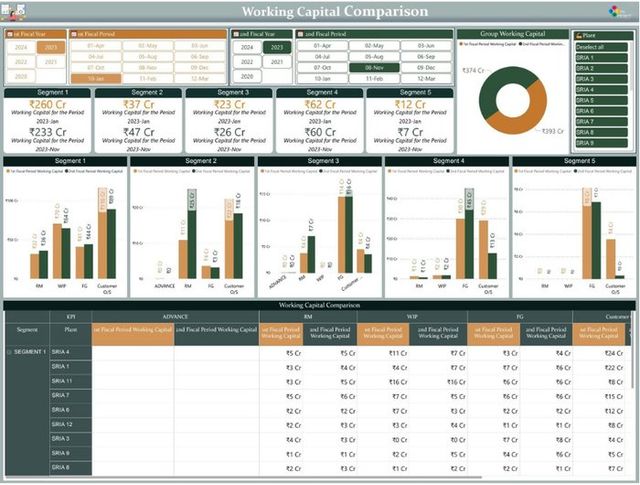
Working capital
Working Capital — Period Comparison
From discovery to steady-state in seven phases
Workshops to map KPIs, data sources and user roles across every business area.
Architecture blueprint, platform selection, security & governance model.
Calculation views, semantic models and data pipelines.
Interactive, role-based dashboards and automated reports.
Validating accuracy, performance and usability with real users.
Production cutover with monitored rollout across the organisation.
Post-launch stabilisation, tuning and ongoing managed support.
Most engagements move from kickoff to go-live within 8–14 weeks, depending on data complexity and the number of business areas in scope — followed by an ongoing hypercare period.
Why partner with Sria Infotech
SAP-focused expertise
A dedicated SAP practice spanning implementation, support and data & analytics — not a generic BI vendor bolt-on.
End-to-end delivery
One partner across architecture, dashboard build, testing, go-live and hypercare — no handoff gaps.
Platform-agnostic guidance
We recommend the architecture that fits your landscape, not the one tied to a single vendor relationship.
Governed & secure by design
Role-based access, enterprise governance and security built into every dashboard from day one.
Let's build your analytics roadmap together
We welcome the chance to walk through any of these architectures in depth and tailor a plan to your SAP landscape. A 45-minute walkthrough is enough to map your first three dashboards.
Talk to us todayUdaya Vensar, 303, Rd No. 1, Hanuman Nagar, Kothaguda, Hyderabad, Telangana 500084